Fluidit 2.1 release is here! There have been 75 new features and improvements and 22 bug fixes in the latest release. In this post, we will cover the major improvements in the software. You can find the full release notes on the support site of Fluidit.
General improvements
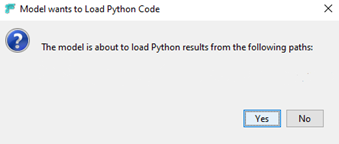
[Security] Dialog to load python scripts
Since 2.1 the following type of disclaimer will pop up when opening a model that has python scripts. This is only a safety measure to give the user control over whether to run the scripts or not.
NOTE: Scripts are used for pumping and valve -station operations. Many models have scripts embedded into them and they don’t work if you do not allow the running of scripts.
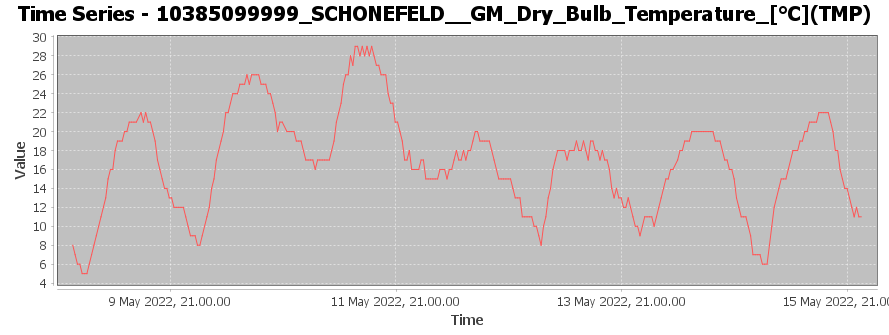
[Feature] Global weather stations
Fluidit Storm, Heat and Sewer now supports global weather stations provided by NOAA (https://www.noaa.gov/). Weather stations in the map extent can be downloaded from Tools -> Weather Stations –> Load NOAA weather stations
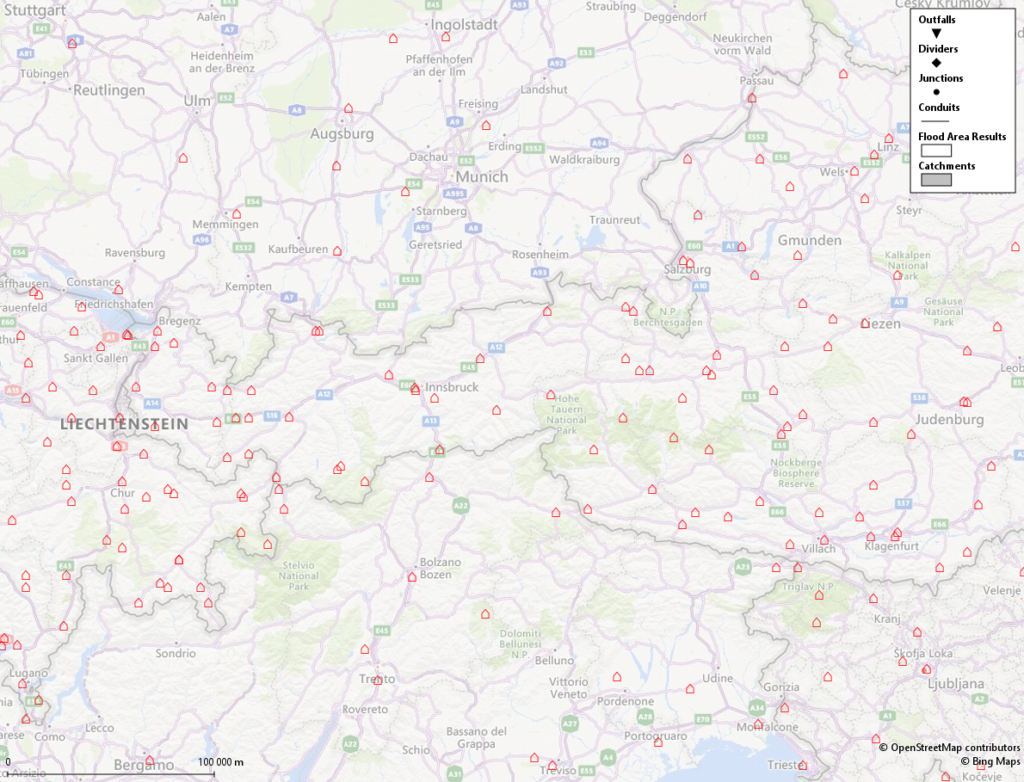
Accessing weather station data is used by downloading the information into time series, which then can be used as input in various places in Fluidit software.
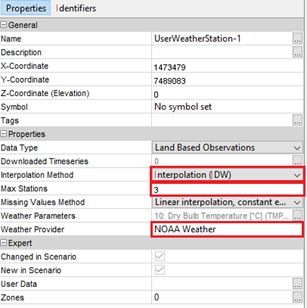
[Feature] User weather stations
In Fluidit Storm, Sewer, and Heat the user can now define their new own weather stations. The icon to add User Weather stations can be found on the top drawing menu of the software.

User weather stations work in two ways:
A) Fetch the data from the nearest weather station (NOAA or FMI)
B) Fetch the data from multiple stations near and form an average value to your selected location
A weather provider in the “User weather station” -attribute needs to be added in both ways.
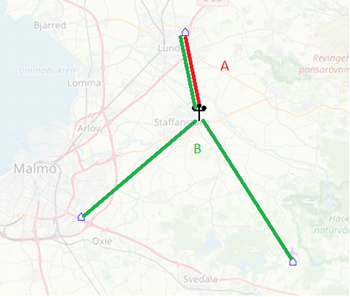
Using option B:
The data needs to be downloaded from the user weather stations in a similar manner to regular weather stations. Data is downloaded as time series that can be used in various places in the software.
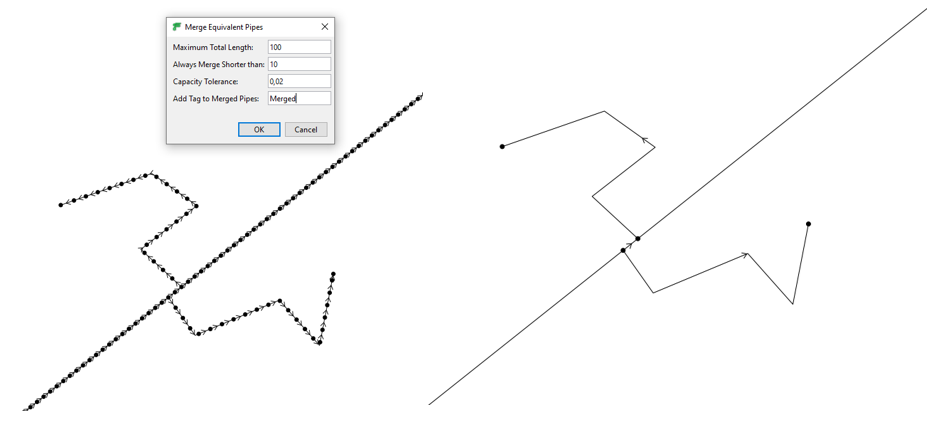
[Feature] Network toolkit
New network enhancement tools can be found under “Tools->Network toolkit”. Under the networking toolkit, we will be collecting various tools to enhance and manipulate the network data.
At the moment there are two features:
- Merge equivalent pipes
- Merge short pipes with the same material type into larger elements with selected tolerances.
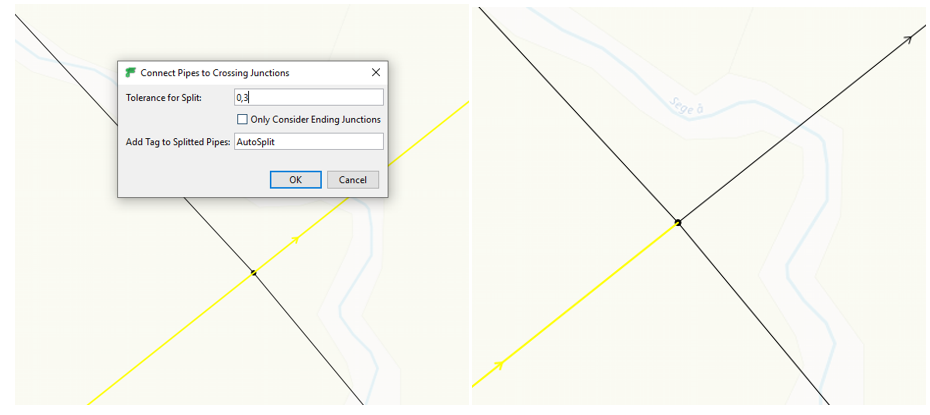
- Connect pipes to crossing junctions
- Split pipes that cross junctions and connect new split pipes into that junction.
[Feature] Global digital elevation models and other improvements
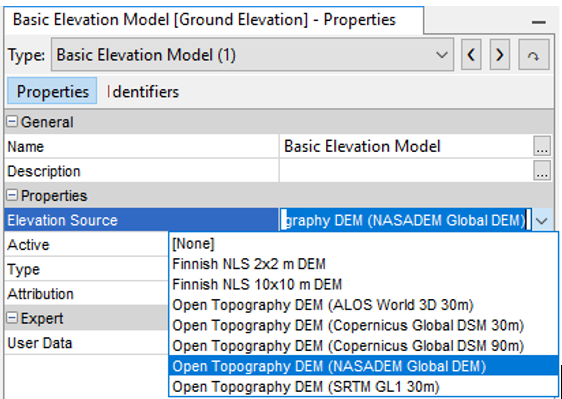
All Fluidit software now supports Global open DEM models. They can be added from the model browser. Global datasets are ALOS, Copernicus Global, NASADEM, and SRTM GL1.
NOTE: Make sure that your DEM resolution is according to the precision of the task you are conducting with Fluidit software and that the DEM covers the area in which you are working. There are gaps in these external datasets that Fluidit does not account for.
Other improvements to digital elevation models include:
- WMTS DEM support, which can be added from right-click -menu over DEM Manager in Model Browser
- Support for credentials to DEM data sources
- “Show another DEM” -feature in Profile View, Profile Figure, and Cross Section Figure, to illustrate multiple elevation models in the figures eg. ground level, bedrock level, and groundwater level.
[Feature] Using external data sources
All Fluidit software have now extensive ability to use external data sources as input data to be shown for example in schematics or anywhere where time series data can be utilized. Usable general data sources at the moment are:
- Influx database
- JDCB database
- Excel data source
- File data sources (csv, tsv…etc)
[Usability] Show curves, patterns, and time series previews in listings
Wherever there are curves, patterns, or time series used, the user can see a preview of the item on the list by pressing down “CTRL” and hoovering over the names of patterns or time series
[Usability] New model validators for
When running a simulation the model validator now checks that the new components have the proper values inserted for the simulation to run.
- Climate
- Rain gage
Fluidit Storm & Sewer specific
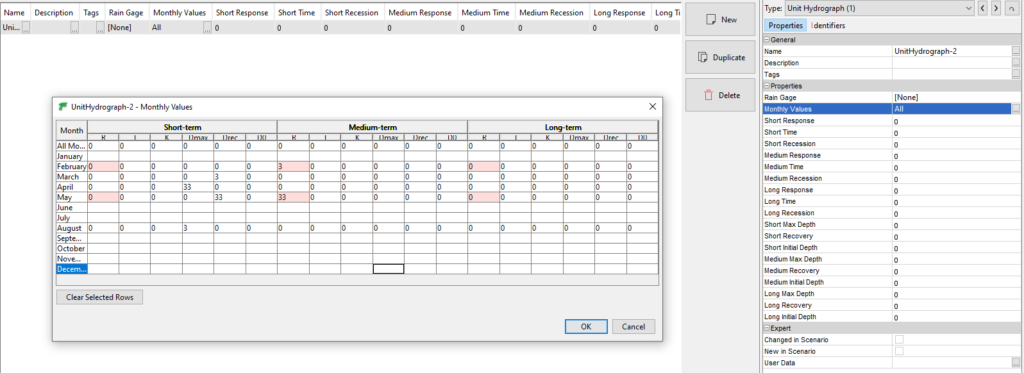
[Usability] Monthly values editor for unit hydrographs
Added UI for editing monthly values for each unit hydrograph. The UI can be found under the properties of each unit hydrograph.
Fluidit Heat Specific
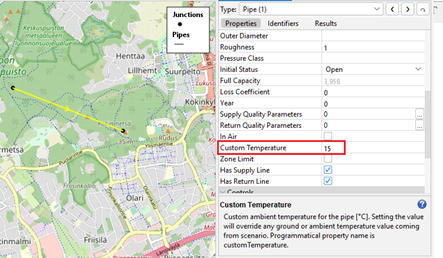
[New feature] Option for fixed surrounding temperature for pipes
Each pipe in Heat can now have a custom temperature to simulate pipelines that run inside buildings or otherwise controlled environments where the temperature does not change with the ambient temperature.
Improvement in Curves
- New curve types in curves
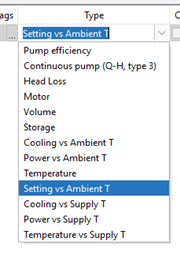
- Using curves in controlling the output rate of shunts